by Scott Howard | Aug 18, 2015 | Marketing and Advertising Insights, The Not-So-Secret Writings of ScLoHo
When I talk to business owners and managers about advertising options, they want to feel good about the money they are going to spend.
Did you see that?
They want to feel good.
They want to feel smart, confident, happy and wise.
Often times this feeling comes from examining facts and figures and from calculating the Return On Investment they will get from spending (investing) in advertising.
This is such an imperfect science that we should eliminate it all together but like I said, people want to feel good when they are going to spend money.
I was talking with a friend recently and we came up with a return on investment that looks like this:
For every $3000 he spends, he needs 3 sales to break even and the 4th sale produces a profit. This is based on 3 years of being in business and the knowledge that he has of his average sale, expenses and those operating numbers.
Great information, I wish more business owners knew this.
What we don’t know is how to accurately track the Return On Investment of each individual advertising and marketing message he has out there.
Here’s why: His truck is logoed up and has his contact info. When he is driving down the road or sitting in traffic, his truck is planting marketing seeds (impressions) on future customers. You can’t accurately measure the Return On Investment of his vehicle wrap can you?
He takes part in some consumer trade shows. Hundreds of people have seen his display and dozens have spoken with him each year. Only a small percentage of the people who see his display (the ones he talks to and gets contact info from) are trackable for Return On Investment measurement.
Advertising and marketing messages overlap. We are exposed to a business via multiple methods which nullifies the results of tracking the Return on Investment of each individual advertising and marketing message.
The web was supposed to be the ultimate source of accurate and fool proof tracking, but it falls victim to the same limitations of measurement that off line marketing has.
You could try combining the two which might help, or produce some really weird and useless ad campaigns like this one from 2012 that tried combining Billboards with QR codes:
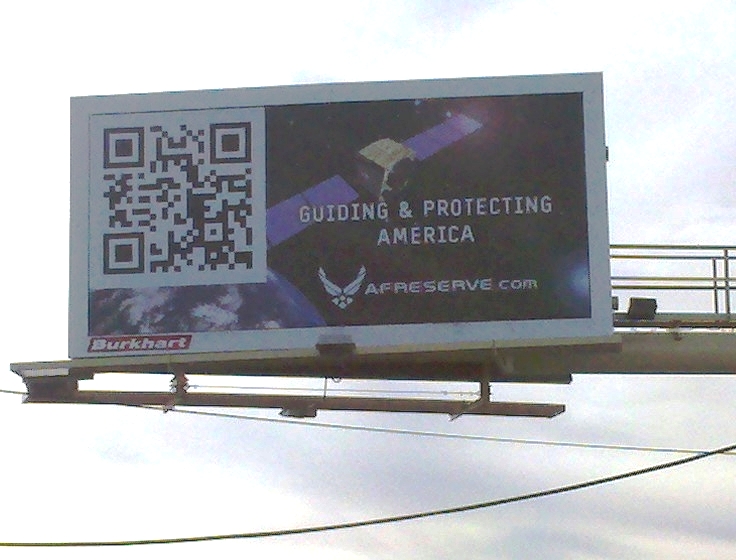
The Unscanable QR Code
So how do you deal with Return On Investment as a way to measure the success of your advertising campaign and more importantly how do you feel good about spending money on advertising?
Ask the right questions.
Know the limitations.
Deal with trustworthy people.
More on this Wednesday.
by Scott Howard | Aug 14, 2015 | Marketing and Advertising Insights, The Not-So-Secret Writings of ScLoHo
Earlier this week I met with a friend and he asked me about a mutual acquaintance. I told him what I know about this other guy and then he shared with me what happened a few days ago. 
This mutual acquaintance had invited lots of people to an exclusive event with a caveat that there was only room for 40 people at this event and, “You have been selected, but reserve now so we can hold your seat…” type of language.
I did not go.
My friend went.
He estimated only 20 people were in attendance.
There was supposed to be a gift for all who attended.
There wasn’t.
The event was supposed to last 3 hours. From what I was told, it went over.
There is a lesson for this mutual acquaintance to learn and it’s one that all of us need to adhere to.
Under promise and over deliver.
Instead of telling us there are only 40 seats, just say we are limiting the number of available seats.
If the gift you were planning on giving didn’t arrive, have a back up gift for everyone.
And if you say something will last 3 hours, finish in less than 3 hours.
I titled this How To Protect Your Reputation In Real Life because I doubt that there is any negative online reviews, bashing or anything that going on on social media…
But,
In face to face conversations, people are talking negatively about this event and this guys reputation.
And for some, those face to face conversations are more Real Life than the internet world.
One more time:
How To Protect Your Reputation In Real Life:
Under promise and over deliver.
by Scott Howard | Aug 13, 2015 | Marketing and Advertising Insights, The Not-So-Secret Writings of ScLoHo
The simplest, most basic way to describe marketing is, Invite People To Do Business With You.
Use this as your yardstick to see if your marketing efforts are focused.
Invite People To Do Business With You applies to your paid radio ads.
Invite People To Do Business With You applies to your business cards.
Invite People To Do Business With You applies to your social media posts.
Invite People To Do Business With You also applies to the way your staff behaves once potential customers visit your business. Because they can also leave without spending any money.
Invite People To Do Business With You when you are not working. You do this by being a nice person. By leaving a positive impression.
Invite People To Do Business With You with your logo-ed shirts and vehicles. And as a side note, be sure anyone and everyone who is driving, riding in, or wearing anything with your name on it gives a positive impression all the time.
Invite People To Do Business With You but don’t be obnoxious about it. Be Friendly. It’s that simple and that hard.
by Scott Howard | Aug 11, 2015 | Marketing and Advertising Insights, ScLoHo's Media, The Not-So-Secret Writings of ScLoHo
Today a word of warning if you are buying television advertising. Especially ads on your local TV station.
I’ll start with the bottom line: Ask for Specific Audience Numbers that tell you how many people will see your commercials. And Beware of Fudgers.
Last month, I was meeting with a law firm and the attorney tells me he only advertises on TV. End of meeting. His call not mine. There were specific questions I wanted to ask him, but he got up and our meeting was over.
While I wish I could have continued the conversation, I don’t care because I am meeting with a couple of his competitors this month.
Last month I also received a new report that is the basis of this article.
The major points are:
- Viewing has actually increased.
- The reason for that increase is technology.
- That same technology means your ads that you place with your local TV station are being seen by less people than ever before…maybe, but probably.
This report says, “digital streaming now represents an estimated one-quarter of time spent watching TV, closing the gap with live TV, which occupies a leading 39% of all time spent using TV content.” 
So the trend for viewing TV is via digital streaming which is now 25% of all television viewing. There’s another number, live TV is only 39% of the time spent watching TV content?! Alarming, but what about the rest? The article continues, “Streaming is on par with time-shifting via DVR, which also captures an estimated one-quarter of viewing time.”
That leaves 11% unaccounted for in this report. Unfortunately reports like this pull numbers out of the research to make their point and are incomplete.
But here’s a couple of take-aways:
Technology has enabled the viewing audience to watch what they want, when they want and where they want. No longer is anyone glued to the TV to watch a show because that is when the show is on.
DVR’s, the technology that allowed us to Fast Forward through the commercials was one challenge local advertisers had and still have. When Bobs Burger Barn commercials come on, we can hit the FF button and skip them. But with these alternative methods of watching our favorite shows with streaming, there is no Bobs Burger Barn ads to skip.
Like I said at the beginning, when you, Mr/Ms Local Business Person are buying ads from your local tv station, ask for numbers on local live viewership during the time slots your ads will air. They probably have plenty, but beware of those who give overblown estimates.
And now you know what kind of questions to ask to determine what you are really buying.
by Scott Howard | Aug 7, 2015 | Marketing and Advertising Insights, The Not-So-Secret Writings of ScLoHo, WOWO Fort Wayne Radio Advertising with Scott Howard
An advertising post today. On a topic that I hear from potential advertising partners. The concept is Media Fragmentation.
First let’s define it.
40 years ago, there were fewer media options for us as consumers.
The same with businesses and advertising options. A business in Fort Wayne had 2 newspapers, a phone book 3 or 4 tv stations and maybe 8 radio stations that served our city.
Now, with the advent of F.C.C. rule changes we have 20+ radio stations. With cable TV, hundreds of channels. The newspapers are hanging on for now, but they have only survived by operating under a joint advertising agreement and the number of readers is at an all time low based on their share of the market.
That’s the correlation that is most often used when describing fragmentation, share of the market. We can step back in time just 10 years and see how the internet really started decreasing everyone’s share of the market, not just in media but all aspects of life.
Actually for awhile there was a contraction in choices for consumers. Look at the small towns that had a Walmart come in and soon the small specialty stores that had been around for decades were shutting down. Walmart was big and shiny and had low prices (and a Made in America pledge).
But now with so many options for consumers to get their news, entertainment and information, how does a business advertise with all of this media fragmentation and decreasing market share of each media?
The reality is that some advertising media options have had very little change in the last several years while others are growing and shrinking big time.
Instead of looking at the numbers as a whole for each option, look at the smaller increments.
So, instead of looking at Broadcast TV, look at how many people watch the 6pm news on channel X. Look at the trends for the past couple of years and decide if that is a good place to place your advertising message.
My radio station, WOWO in Fort Wayne which I joined a couple years ago, has consistently had over 100,000 listeners every week for as long as I have data. This makes it consistently the station with the most listeners in the Fort Wayne area. Half the other stations in town have changed formats since 2013. But most businesses would have difficulty if just 1% of our listeners became new customers every week. So I’ll offer a smaller increment.
Instead of placing your ads anywhere during the 168 hours in a week, I’ll suggest 15 hours a week. That’s 3 hours Monday through Friday on one of our talk shows. With that kind of self imposed fragmenting, I can still tell 50,000 of our listeners (or more) each week about your business.
Before we leave this subject of market share and fragmentation, a quick story from 10 years ago:
I was meeting with a cranky old guy who owns a few auto repair places about advertising on our radio station. “Hank” commented that there are too many radio stations, in Fort Wayne etc. I asked him for his copy of the yellow pages.
I found the page listing radio stations and ripped it out and handed it to him. Before he could say anything about my tearing up his phone book, I flipped to the Auto Repair section and found 20 pages filed with his competitors. Again I tore all 20 pages out and then asked him how he is able to survive?
He was speechless for a moment over the gall I had to tear up his phone book until I handed him a new book. And he also understood that his industry was more more fragmented and why he was losing market share each year unless he started inviting more people to do business at his shops.
by Scott Howard | Jul 29, 2015 | Marketing and Advertising Insights, The Not-So-Secret Writings of ScLoHo, WOWO Fort Wayne Radio Advertising with Scott Howard
I was asked a question the other day about radio station ratings and surveys and where it all comes from… 
So today, a primer on how radio and other media get this information and what it means.
There are two independent companies that conduct surveys to determine who listens to radio stations and watches tv shows.
I’ll focus on radio, you can ask someone in the tv business how it works in their business. While it is similar, there are some differences.
The two companies that measure radio listenership are Eastlan and Nielsen. Nielsen bought Arbitron which was the standard for decades.
However Arbitron/Nielsen has had some flaws in their methodology that they were slow to fix. Along comes a new research firm in 1999 designed to overcome the complaints that were not being addressed by Arbitron.
Arbitron used a diary method of record keeping. Listeners were contacted by phone to qualify to be in a survey. Then they were mailed a survey book to fill out for 7 days and return by mail. The flaws in this system were multiple with the changes in technology. First off you had to have a landline phone, cellphones were not included. With the number of homes discontinuing home phones, this became a problem in getting a big enough sample especially of certain demographics. Then just because you qualified someone and sent them a diary to fill out, would they do it? The response rate shrunk the sample even more.
Accuracy of the data in the diary was always questionable. But Arbitron tried to overcome all of this with a new way of collecting data. …Arbitron’s launch of the Personal People Meter, or PPM, in 2007. The PPM is a small, wearable device that measures what radio stations people listen to.
However the PPM with its hand off approach is expensive and also considered inaccurate. Only Major and Large Markets are using PPM’s. Fort Wayne is ranked as market #113 and Nielsen uses the old paper dairy method.
Along comes Eastlan and they have a plan to build a better research company. From their website:
- Sample Size Eastlan sample sizes are significantly larger-often by hundreds. Eastlan also believes in surveying only one person per household for broader representation.
- Weighting No response rate problems here. Eastlan’s hybrid of random stratified telephone-recall sample and daily e-surveys is very precise and closely matches the population composition of the survey area. By contrast, diary methodology surveys tend to be heavily weighted as telephone calls or direct mail are used to place diaries but there is no control over which diaries are actually returned.
Now you know a bit about how the data is gathered. By an independent research company (Eastlan) that sells access to their research to radio stations and others who want to know. When I mention that WOWO has over 100,000 listeners, that is from the information I have access to from Eastlan.
I can drill down into the data, using the software from Eastlan and pull reports and data on all kinds of demographics for Fort Wayne radio stations and their listeners.
Some of the information is interesting but not very useful. For example I can see that WOWO averages over 7000 listeners that are age 18 and older at any time during the week, compared to the next highest station which has less than 5000. Here’s why this is not very useful. This number represents an average number of all 168 hours in a week, 24/7. A more useful number would be the total number of weekly adult listeners 24/7. Again WOWO dominates was the only station with over 100,000 adults age 18 and older. The #2 station has 10,000 less according to the rating data.
Surveys in Fort Wayne are done twice a year, in the Spring and Fall and we get the results a few weeks after they are concluded.
Before I wrap this up, I’ll touch on the other advertising media options and how they measure their audience.
Print which includes magazines and newspapers offer counts in a couple of ways. There are the number of subscribers and the number of papers published. Neither number really tells us how many readers they have.
Billboards use traffic counts. Using data from the highway departments they have estimates of how many vehicles drive past each sign. Again, this doesn’t really count how many people looked up and read your message as they drove by.
How about the web and digital marketing? We have gotten better at determining how many people have seen a page, an ad or visited a website and clicked on something. However there are still several missing links in the chain of events that leads from that first exposure online to tracking the purchases. I learned this when I worked for an internet based retailer and saw differences in our own internal tracking systems and Google Analytics.
Questions? Go ahead and ask.